(Classic) Debugging KRL Rulesets
Because KRL rulesets run in the cloud, it can often be difficult to know just how to go about debugging them.
First, read (Classic) Tips for Developers.
Seeing the Ruleset
The describe API provides a way to see information about a ruleset.
https://cs.kobj.net/ruleset/describe/b507199x0.prod;b16x16.dev
This can be useful for seeing the last time the ruleset was flushed, the functions it provides, the rules it defines, and the select statements for each rule.
Using the Sky Event Console
The Sky Event Console is a Chrome application that raises events directly to the Sky API.
You can download the source code for the Sky Event Console from github.com. You install it as an unpacked extension from the source from the Extensions page in Chrome.
Once you do, the console looks like this:
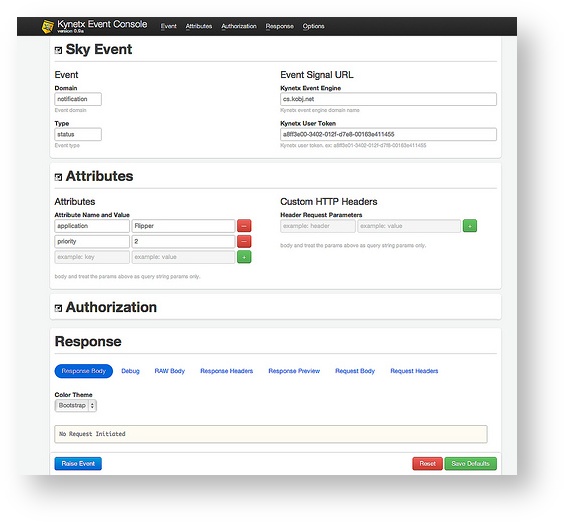
You can enter the event domain and type, a token, and any event attributes.
- Clicking on the “Raise Event” button at the bottom raises the event to the specified event engine for the user identified by the token.
- Any rule sets that are salient for the given event are executed and the results are returned and show at the bottom.
- Clicking the “Debug” button shows the debug results.
- The console saves your last inputs from invocation to invocation. You can also easily see the raw response, response headers, request body, and request headers.
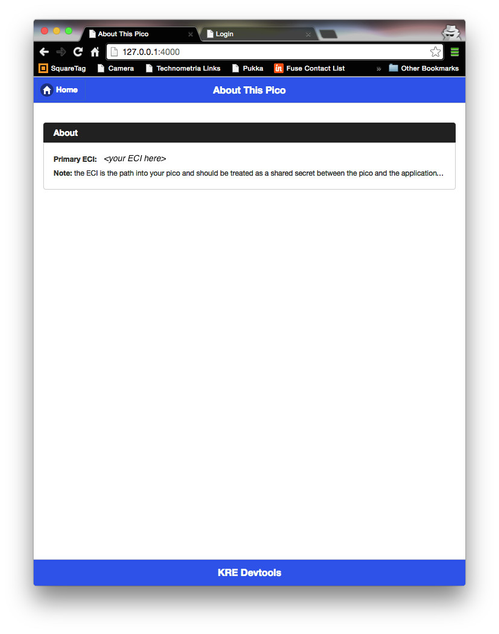
To use the Sky API, also need to know how to get an event channel identifier (ECI) for your pico. You can retrieve the primary, OAuth ECI for the account using the About function of the KRL Developer Tools application.
Using the Pico Logger
The KRL Developer Tools application uses the built-in pico logging system to show logging data from events raised to a pico. The logging page looks like this:
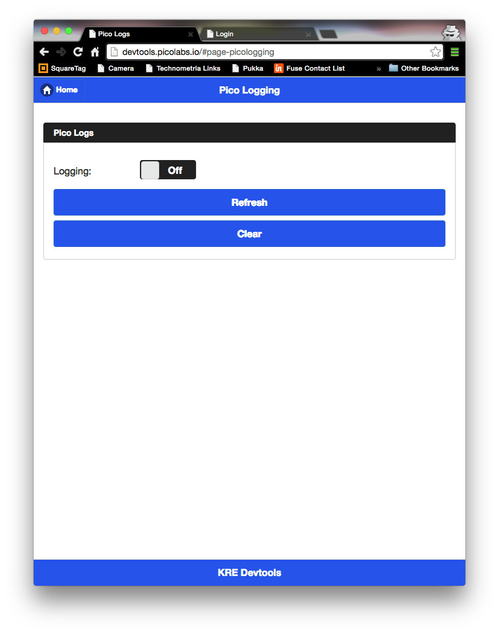
Normally logging is turned off. Flip the switch to enable it. Once enabled, any event sent to the pico and any query made to a ruleset in the pico will be logged.
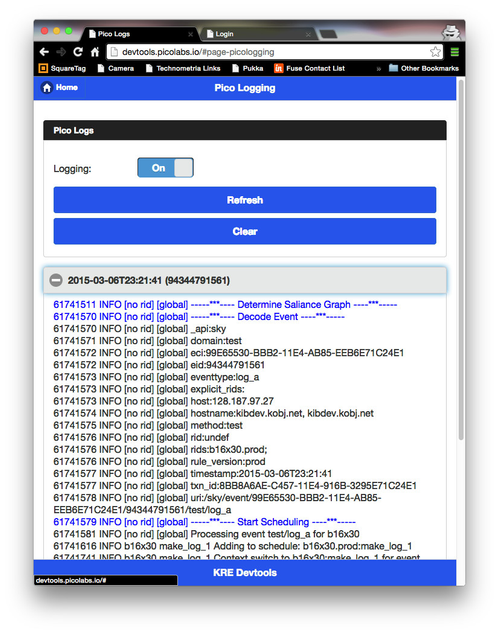
The log data shows the execution of rules and functions relevant to the event raised or query made. Each line contains
- milliseconds since the process started
- logging level (INFO, WARN, ERROR)
- ruleset ID, if applicable
- rule name, if applicable
- logging message
error events, the log statement, and the klog() operator to send logging data to a error processing rule. Refresh button to refresh the list of logs. The Clear button clears the logs. Copyright Picolabs | Licensed under Creative Commons.